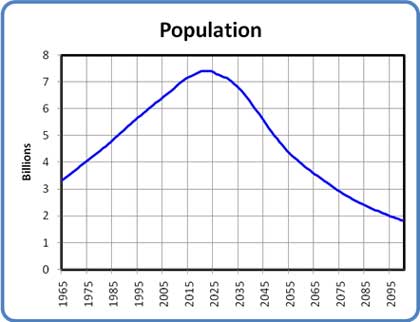
Population Growth: 1965-2095
Category
Level
Image Type
 Visualizing sustainable solutions to global and local problems so society makes informed choices quicker.
Indian population map 2006
Some models show population growth leading to resource depletion, which can result in declining food production, industrial output, and population.
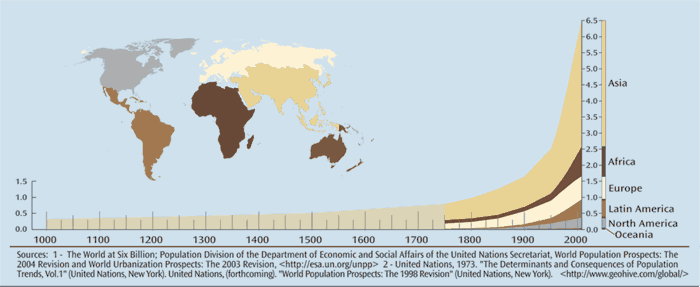
world population 1750-2050
UN Estimate Vs. World Growth
Directly or indirectly, the human species already captures nearly 40% of the total biological productivity on land and 70% of the productivity of the marine environment - the "net primary productivity" of the planet - for its exclusive use. The rate of increase in human use is about 2% per year."
