
Temperatures in the Contiguous 48 United States, 1901-2013
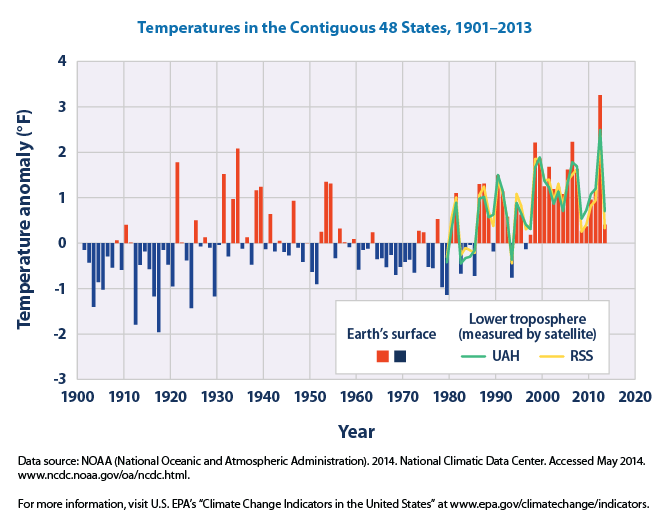
“This figure shows how annual average temperatures in the contiguous 48 states have changed since 1901. Surface data come from land-based weather stations. Satellite measurements cover the lower troposphere, which is the lowest level of the Earth’s atmosphere. “UAH” and “RSS” represent two different methods of analyzing the original satellite measurements. This graph uses the 1901–2000 average as a baseline for depicting change. Choosing a different baseline period would not change the shape of the data over time.” – United States Environmental Protection Agency
When compared to the 1901-2000 baseline average, a positive temperature anomaly has become much more common and extreme since the 1970s in the United States.
Year
Image Type
Category
Level
Geographic Area
Source
http://www.epa.gov/climatechange/science/indicators/weather-climate/temperature.html