
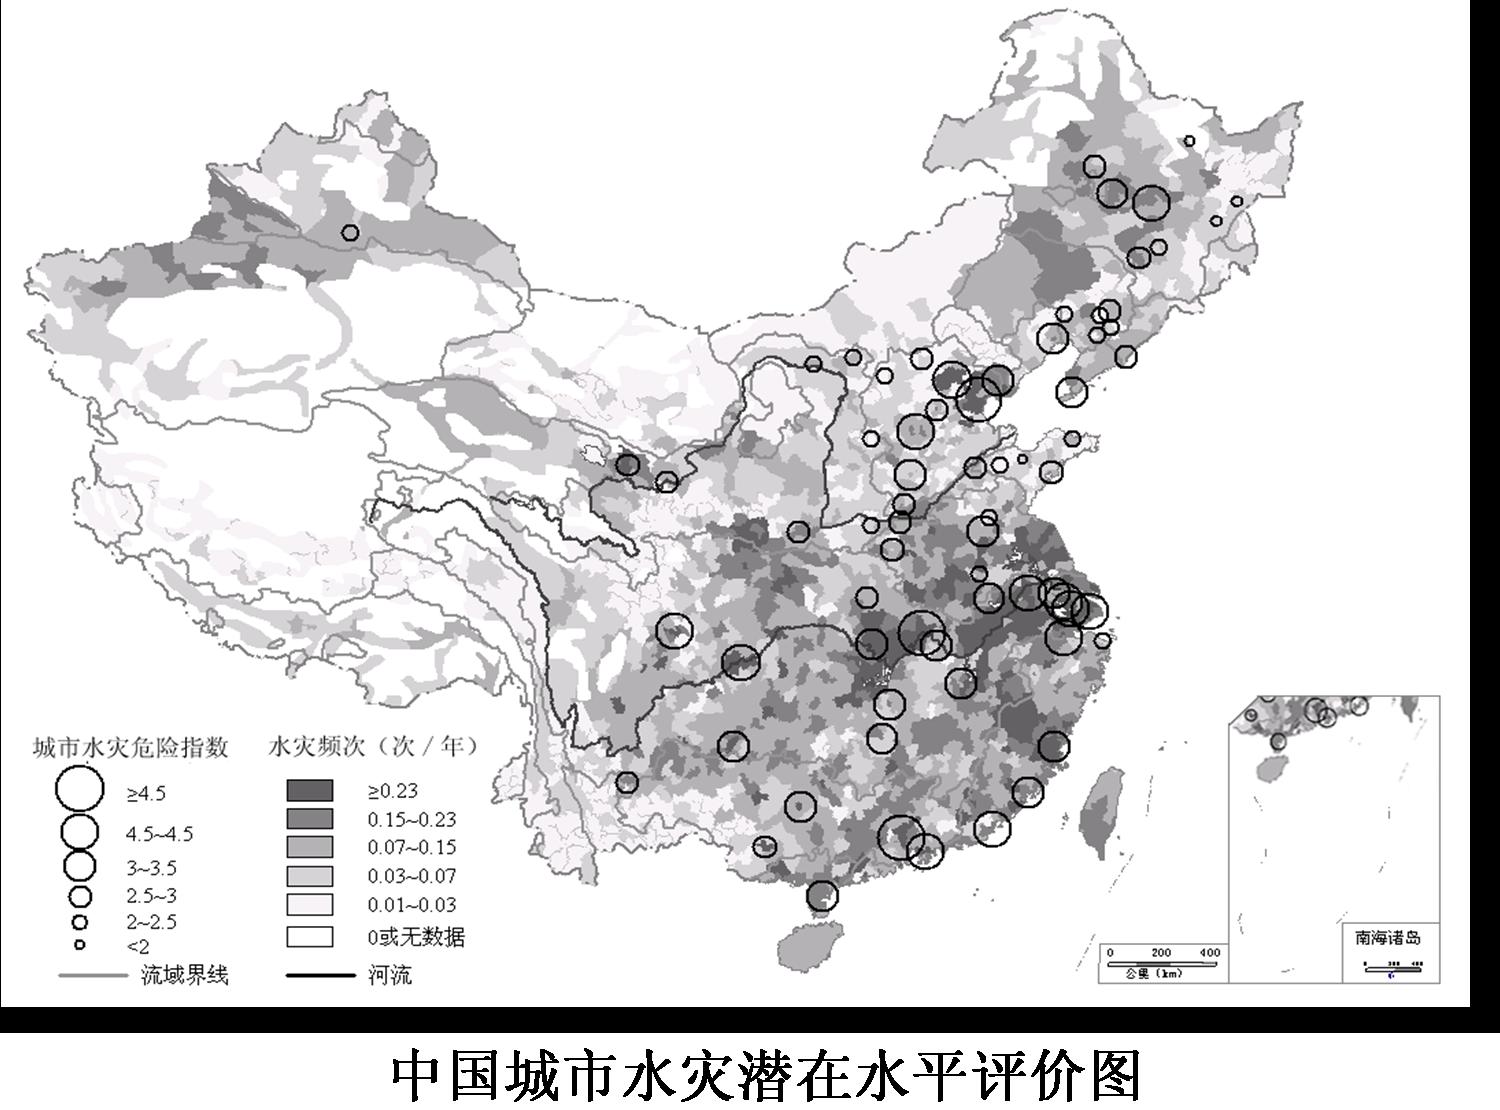
Risk Analysis Graph of China's Floods
here are the legends:
Left Column:
Risk index of floods in cities
numbers...
flowing boundaries
Right Column:
Flood Frequency in times/year
Rivers
Year
Image Type
Category
Level
Geographic Area
Source
http://bbs.geonet.cn/thread-13384-1-1.html